Finally: Dynamic charting in WSS, no code required!
- Finally: Dynamic charting in WSS, no code required!
- Finally: Dynamic charting in WSS, no code required! – Part 2
- Finally: Dynamic charting in WSS, no code required! – Part 3 – Multiple Pie Charts
A note from Mark Miller: When i first saw this solution, my jaw dropped! Could this actually be a viable alternative for WSS users who don’t have Excel Services? You be the judge… please give Claudio some feedback on how you will use his solution.
Update: The script has been updated so that the page loads before the script is triggered. You can read more about it in the comments.
Author: Claudio Cabaleyro , MOSS 2007 – (almost) no-code solutions
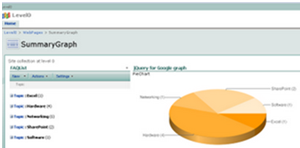
Inspired by the GREAT jQuery series by Paul Grenier at EndUserSharePoint and the TERRIFIC ideas of Christophe at Sparklines and other charts in SharePoint lists, I have built a small jQuery script and used Google Charts service to get the following (click to enlarge):

I based the example in a FAQ list, so the chart shows the distribution of questions among the different “Topics”.
Being a little more general, the chart shows the statistical distribution of items from an underlying SharePoint list, being the groups defined by the meaning of the column chosen to “Group by” in the list view.
You can think of representing statuses of an issues list, completion percentages on a task list, and so on. You can even explore the use of calculated columns in innovative ways to define your groups… (I just thought about that!)
Solution
I will not present a detailed step-by-step approach here, you can drop me a note if you have doubts.
Recipe:
- On the list you want to base your chart, create a “Group By” view.
- Create a new web part page and insert the just created list view.
- Insert a Content Editor Web Part and paste the code below (remember to use the Source Editor).
That’s it!
NOTICE: if you are new to jQuery, you need to install it prior to use the code. You just need to upload it on a Document Library as explained here, Do not forget to adjust the path at the beginning of the code, to point to your library.
*** UPDATE: when you copy the code to your script editor, take a look at quotes (single and double) as they can cause a wrong script.
Pie Chart Using Google Charting API
Tips and Tricks
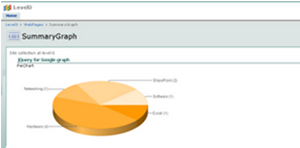
TIP I: you can hide the list view in your page so only the chart is rendered (click to enlarge):

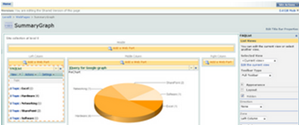
To do that, edit the page and look for the "Hidden" check box in the web part panel(click to enlarge):

TIP II: you can experiment changing the chart type, colors and size through the parameters in the URL by the end of the code. Check the Google Charts API documentation and have fun!!!
Author: Claudio Cabaleyro , MOSS 2007 - (almost) no-code solutions
- Finally: Dynamic charting in WSS, no code required!
- Finally: Dynamic charting in WSS, no code required! - Part 2
- Finally: Dynamic charting in WSS, no code required! - Part 3 - Multiple Pie Charts


How do I connect the Content Editor Web Part to the Group By view that I added? I have multiple group by views on the page I’m adding the chart and I want to point the chart to just one of these.
Fantastic Idea! I wasn’t aware of the Google Graphing API until just now!
I’m having an issue though, it seems as if using the code above it’s not parsing my list correctly.
When I get to the page, the portion which should be a graph is an empty image.
The url it’s trying to use is:
http://chart.apis.google.com/chart?cht=p3&chs=750×200&chd=t:&chl=
Seems as if it’s not filling out txt and txt1:
=t:”+txt+”&chl=”+txt1+”
Is there some additional configuration needed to this code to tell it how to find our list?
I figured out my issue. For some reason my Javascript jQuery was firing before the table loaded, as such there were 0 items in the array.
Started by doing an alert(arrayList.length) and getting 0 back.
As such, a much more clever fella here at work recommended me wrap the code in a statement to allow the document to load prior to firing off and that fixed the issue!
$(”document”).ready(function(){
var arrayList=$(”td.ms-gb:contains(’:')”);
….. more code…..
});
Nick – Did you create a document library, load all the files extracted into that library and then change the references in the .dwp parts>? — Mark
Kevin – You’ll have to figure that one out on your own unless Claudio jumps in and has something to add. — Mark
I had someone much smarter than me look at it and they came to the conclusion through the use of some creative “alerts()” that my javascript was trying to execute before the list was even loaded..
So initially my array.length() was 0…
My co-worker recommended a small addition to the code to ensure it only fires once the document is fully rendered, something like the following:
$(”document”).ready(function(){
});
Encasing all of the jquery code into this “block” ensured it wouldn’t fire until the document was loaded completely and then my graph rendered fine!
Nick – Thanks for the follow up. I’ll have some people take a look at confirm. — Mark
Nick is right. The jQuery document ready event will help immensely.
Does this one sends data to google and get u the new image every time .. trying to see if this has dependency on Google site ?
Paul – I know you have a standard way to do this. Would you recommend the way that Nick is showing or is there a “best practices” we should be considering here? — Mark
Sandeep – Yes, there is a call made to the Google API. I am running a secure connection on my SharePoint site, so everytime the page loads, I get an “Insecure Data” type warning and that’s where it’s coming from. — Mark
Thanks Mark and all for the interest and sorry if the script is a little buggy (it is). Some comments to questions raised above:
Kevin, I am working on a multiple charts per page solution, that I hope will address your point. The script as it currently is just uses the first List View Web Part in the page.
Nick you fixed it right! I just have experienced your problem today, when I tried to put the CEWP to the left of the list.
Finally, I am trying to catch up on Paul’s great best practices, but sometimes I cannot cope with his speed… next time I will do better.
Best regards!
sparklines is one of new visualization type of charts. There are more at style chart. It’s a free service, you can also create your own charts and embed them.
This is fantastic! Thank you for sharing this type of “no code” content. It is proving to be extremely valuable in customizing our SharePoint sites.
Awesome solution! Anyone know how we might be able to display the actual percentage of each item?
I found this very informative and I was able to make a graph of a list in less than a minute.
I did find that I was limited to one graph per page though so I figured a work around with the code you provided. I posted it on my blog here.
http://wyly.wordpress.com/category/sharepoint-dashboard/
I’m thinking of digging deeper here writing about how to inclorporate the bar graphs, charts and google-o-meters with the same code.
Thanks for a great post!
FANTASTIC. I put this to immediate use, it’s amazing!
I have follows the instructions and have not managed to get this to work. I have just the jquery.js in the library
Hello
Thanks for superb article. I implemented your example with pie chart. Thne I tried to implement bar chart using following
var vinc= “”;
It is displaying bar graph, but at the bottom count and field name are overlapping. In this regard I have following queries
1. Can we increase the space between the bar, so field value should display properly
2. How can we display count of field on top of each bar respectively
3. How can I display stacked bar?
Please advise
Sham,
check quotes when you paste the code, specially in the following line:
$(”td.ms-gb:contains(’:')”);
Dishaniti,
1- Sure you can modify the space between bars. You just need to add a parameter in the URL line like this: &chbh=,,. Replace each expression with the number of pixels.
Check at Google Charts API documentation for more details, but you can test building the URL with some test data in notepad and pasting into a browser window. Cycle through this until you get the desired result then modify the script.
2- To add labels to the bars, you can use another parameter in the following form: &chm=N*f0*,000000,0,-1,11
Take into account that a problem arises with bar charts, not present with pie charts: you need to properly scale the chart to the values to represent in each specific scenario. This is done with another parameter “&chds”. We could make this parameter variable if we put the maximum value to represent. I used this approach in Part II of this series, maybe you can try to adapt this trick here.
3- I am working on a stacked bars solution I hope to release any time soon.
Regards,
Claudio
Although I previously mentioned how amazing this is, after reading that it sends our internal data without encryption to Google I had to pull the charts. Great solution all the same for public content.
Does anyone know how to conver the total count to percentage for the pie chart?
Nicole, I just figured it out, here is the amended code to have percentages instead of sum.
http://wyly.wordpress.com/category/sharepoint-dashboard/
Just copy and paste the amended code. Hope this helps!
If you cannot send unencrypted code to google, there is a custom part chart available for free on codeplex.
You will have to talk you administrator into adding the .net chart control framework to your Sharepoint servers, but it will allow you to make charts w/o sending data outside of sharepoint. The details can be found here.
http://chartpart.codeplex.com/
Thanks. i found another problem on my chart. I am trying to use the sum of the column in the group view. Not the total count of the column (some columns might have the number of 2). That’s why my chart is not display correct.
How do I do sum instead of total of the columns?
thank you.
Finally got this working!! Not an error on with the code but in my column which is used to make the labels I was using brackets e.g text text (text) – this was causing the image not to render!
Really useful, going to see if I can get the rest to work!
Awesome. I have read your article. Mind blowing …
Is it possible to get this to work with a Data View? This would be sweet if I could get it to work with a Data View I created using a Database Connection in SPD.
??
Thanks
Kerrie
Kerrie,
I am not sure if this can help, but you can try to discover if can identify a DOM object where your Data View web part renders your numbers, then modify the following line of the code:
var arrayList=$(”td.ms-gb:contains(’:')”);
this line defines a jQuery variable that stores all the totals to be plotted, and they are found using a jQuery selector (the whole thing between parenthesis). In the standard List View web part, the totals are within an html table row with cells of class “ms-gb” that contains the “:” symbol. This translates from english into jQuery the way you see above.
Take a look around your Data View numbers using Firebug or inspect your page source code and search html tags around them that could help.
Good luck!
Elegant!
I have two problems. I am grouping list items by employee name. I draw the names from an enterprise source that includes parentheses on occasion as part of the name. Your parser has a problem with that.
Secondly I am adapting your code for horizontal bars. Google has chosen to make the first value in the series the top bar, while the first label in the series is assigned to the bottom bar. So there is a mismatch using your text strings containing the values and labels. Are you working on that one?
Hi Jay,
You are right with the limitation on parenthesis, the following line:
var txt= MyIf.substring(MyIf.indexOf(’(')+1,MyIf.length-1);
in plain english that could state: extract the portion of the MyIf string starting from the position of the first “(” and to the position before the first “)”. In most cases, this contains the number of items within the group. But if your groups names also contain parenthesis, it wont work. As you mentioned your names occasionally contain parenthesis, I do not see an evident way to look for the number. You could try to learn on “regular expressions” that I think could help to build a better selector for your item totals (can not promise, but I will try to do that in the future).
Regarding the horizontal bars your are working on, you could try to reverse one of the arrays, like this:
var txt1= labels.reverse().join(”|”);
good luck!
Claudio,
I got it to work. I used lastIndexOf(’(') in the parsing statement instead of indexOf.
I also changed the txt1 parsing to var txt1= MyIf.substring(MyIf.indexOf(’:')+2,MyIf.lastIndexOf(”(”)-2); which eliminated a space and allowed me to use that string as data in an xy chart (in the case where the labels are numbers).
Hi Jay, glad to here about your fix and thanks. I know now another JavaScript method (I am far from an expert).
Regards.
can you use this same code/approach to create graphs from a DATAVIEW. I have some SQL queries that were created in Sharepoint Designer and I have put the DATAVIEW on my site and the data looks how I would like, would like to now just add a graph from that info. Everything I see keeps pointing back to SHAREPOINT LISTS. please advise…
I used your code and was able to generate a pie chart very quickly. The problem I am having is the pie chart is using the number of occurences of the various values in the group. Within my view I am totaling a different field and though my view is providing subtotals by the group which is what I need, I also need the chart to reference the subtotal values rather than the number of occurences. Where in the jquery code is the group occurence being referenced and how could I modify the code to reference the subtotals instead?
Hi Bob,
My code get the item occurences looking for the html tag that Sharepoint uses, wich is through the “td.ms-gb:contains(’:')” selector.
For sub-totals, the situation is a bit more complex, actually I have been working to plot subtotals, but did not have time to finish an article on that. For you to have an idea, the selector to get the totals an sub-totals look like the following: tbody[id^='aggr'] b
Please be patient I hope to publish that soon.
Very slick! Thanks so much, Claudio!
Claudio,
I have included the code we used to create a piechart using a subtotal field within the view. The view consist of a list of resources allocated by days against various activity types. I grouped the data by the various activity types and totaled the days allocated field. I was able to use the days subtotal field by each group within a pie chart to reflect the total days allocated by activity type within the pie chart. I also used some code posted on this site to customize the label for each subtotal replacing the word “Sum” with “Total Days by Activity Type”.
Here is the code I used:
INSERT CHART TITLE HERE
if(typeof jQuery==”undefined”){
var jQPath=”http://ajax.googleapis.com/ajax/libs/jquery/1.3.2/”;
document.write(”");
}
$(”document”).ready(function(){
var arrayList=$(”td.ms-gb:contains(’:')”);
//var coord= new Array();
var labels= new Array();
$.each(arrayList, function(i,e)
{
var MyIf= $(e).text();
//var txt= MyIf.substring(MyIf.indexOf(’(')+1,MyIf.length-1); // Extract the ‘Y’ coordinates
//coord[i]=txt;
var txt1= MyIf.substring(MyIf.indexOf(’:')+2,MyIf.indexOf(”(”)-1); // Extract the labels
labels[i]=txt1; //add also coordinates for better read
});
//sum data
var arrayListSum=$(”NOBR:contains(’Sum = ‘)”);
var arraySum= new Array();
$.each(arrayListSum, function(i,e)
{
if(i > 0){ var MySum= $(e).text();
var txt= MySum.substring(MySum.indexOf(’Sum =’)+6,MySum.length); // Extract sum number
arraySum[i-1]=txt;
labels[i-1]=labels[i-1]+”(”+txt+”)”; //add also coordinates for better read
}
});
var txt= arraySum.join(”,”);
var txt1= labels.join(”|”);
// Adjust Chart Properties below – See Google Charts API for reference
var vinc= “”;
$(”#jLoadMe”).append(”"+vinc+”")
});
Hi
Is there an update to this at all as I cannot get it to work regardless of the way I try to implement.
Iain
Hi Claudio,
An update to your instructions using Bob’s method to tally and display dollar sum totals of the items groups would be really Cool!
Greate article btw. Please add how to show dollar subtotals! please! please! :)
Hi Iain,
a coupe of suggestions to debug:
Delete an undesired backslash in the script closing tag for the jQuery load in the line:
document.write…
Replace the line:
$(#jLoadme)…
with:
alert(vinc);
and let me know what you get.
regards,
Hi Bob,
glad to hear of your customization!
Really clever your selector to find the subtotal values:
$(”NOBR:contains(’Sum = ‘)”);
Thanks for sharing!