
Multiple Pie Charts in a WSS Dashboard
Note from EndUserSharePoint.com: We have updated the script below and apologize for the previous error.
From the feedback I received on my previous posts, I worked to develop a new jQuery script to present charts on SharePoint. It can be considered a major evolution of my first rudimentary pie charts versions because:
- It uses pure JavaScript libraries, no need to send data to the Google Charts API (i.e. internet).
– Charts are nicely arranged within an HTML table, with configurable columns.
– When you click on a chart, you jump to a target page showing the underlying list view.
– Represented data can be taken from different SharePoint lists.
- At least in theory, an unlimited number of charts can be accommodated on a page.
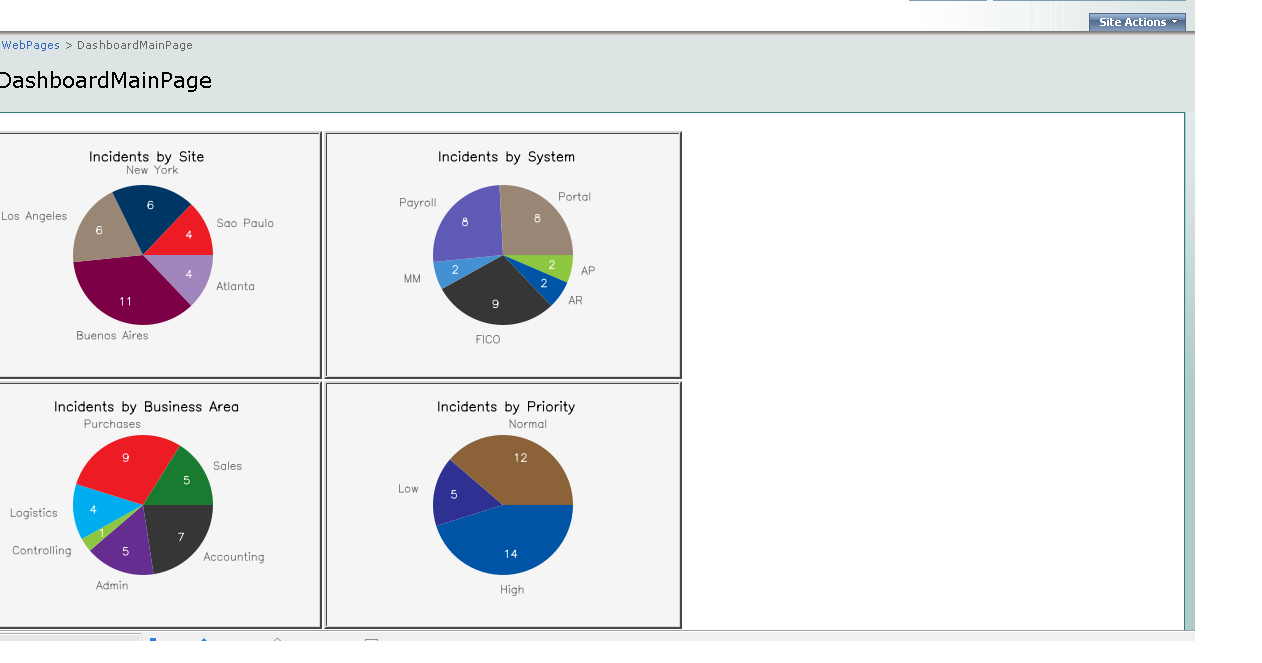
Here is how the result looks like:
I achieved that with the help of the free jsCharts library, and the invaluable code of Paul Grenier, in particular on this EUSP article.
What’s the trick? Let us take a brief look at the actual objects on the page:

The charts are within a Content Editor Web Part holding the script, in this case stored as a file on a document library (another trick I have learned from Paul Grenier). Below of the CEWP, there are 4 List View web parts showing grouped items. In the example, I made List View web parts hidden and used only one list, but this is not strictly necessary.
So, what do you need to put this at work?
I will assume that you know how to: create grouped views on lists, create web part pages, add list view web parts and configure them to show specific views. I will also assume that you have jQuery available on your site and know how to insert a script on a Content Editor Web Part. Drop me a note if something below is too badly explained.
In the first place, you need the jsCharts library available, for example stored on the document library that you use for jQuery:

Second step is to create the Grouped Views you plan to use for your charts, using the default SharePoint list view page:

Now you are ready to build your dashboard target pages, using one of the grouped views you just created on each new page. Here is an example:

Build as many pages as lists grouped views you plan to show as Pie Charts, but take into account that if you put too many charts, loading the dashboard page can take a while. Keep track of the URL of each new page as you will need it later to configure the script.
NOTE: you will probably ask why instead of creating different pages to show charts underlying data, do not use the already available web parts on the dashboard page… quite frankly, me too!… I did not find yet the way to do that, but it could make the dashboard much more elegant.
The time to create the dashboard page has come!
Create a new web part page and insert the Content Editor Web Part to hold the script for the charts. Then add and arrange the list views in the order you want the charts to be displayed. For each list view, configure the following on the tool panel:
- Selected View (choose one of the views you formerly created).
– Title (this will be presented as the chart title)
- On the Layout section select “Hidden” (check box).

Now open your favorite text editor an paste the complete script code by the end of this post. Configure the path for your jQuery and jsCharts document library in the following section:
<script src="/jquery/jquery.js";  type="text/javascript";>
  // To load jQuery (redefine the path  if necessary)
  </script>
  <script type="text/javascript";  src="/jquery/jscharts.js";></script>
// To load jsCharts (redefine the path if necessary)
Then configure the quantity of columns for the table that will contain the charts, and paste the URLs of the target web pages in the “;goPage”; array. Remember to strip out the “;http://YourSite”; initial part, and write them in the order that matches the respective list views on the page.
  // DASHBOARD CONFIGURATION
  var goPage=new  Array('/WebPages/DashboardPage1.aspx','/WebPages/DashboardPage2.aspx','/WebPages/DashboardPage3.aspx','/WebPages/DashboardPage4.aspx');
  var cols = 2 //Number of columns for  the charts table
  // END OF CONFIGURATION
Finally, paste the script on the Source Editor of the Content Editor Web Part, or upload the file on a document library and use the “;Content link”; option. Press the “;Apply”; button and you should get your charts rendered.
Further customizations
Maybe you want to go further and change other features of the solution. For example you can experiment with charts table styling:
 <script><style type="text/css";>
  td.tableCell
  {
  background-color:#F5F5F5;
  border-style: ridge;
  text-align: center;
  }
  </style>
Or you can customize charts properties, like the ones included in the script:
myChart.setSize(350, 240);
  myChart.setPieValuesFontSize(9);
  myChart.setPieUnitsFontSize(9);
  myChart.setPieRadius(70);
  myChart.setTitleColor('#000000');
There are several properties you can adjust on jsCharts, review the documentation on their site and have fun!
Follows the complete script. Please let me know if there is any error, as Blogger does not like to show code so a syntax problem could occur on its transcription:
  <!-- Script to create a dashboard on a web part page. Pie charts, created using jsChart, -->
<!-- are organized on a table, and are "clickable", pointing to other pages of the site. -->
<!-- The quantity of charts is defined by the list view web parts included on the main  -->
<!-- page and titles of the charts are automatically detected. List views can be hidden.  -->
<!-- Look below the script configuration options  -->

<table id="chartsTable">
      <tbody>
      </tbody>
</table>

<style type="text/css">
       td.tableCell
        {
 		  background-color:#F5F5F5;
		  border-style: ridge;
		  text-align: center;
		}
</style>

<script src="/jquery/jquery.js" type="text/javascript">
   // To load jQuery (redefine the path if necessary)
</script>
<script type="text/javascript" src="/jquery/jscharts.js"></script>
// To load jsCharts (redefine the path if necessary)

<script type="text/javascript">
/*
* WORKING VERSION 3.0
* Multiple Clickable charts, with jsCharts
* By Claudio Cabaleyro (2009)
*/

$("document").ready(function ($) {

// DASHBOARD CONFIGURATION
var goPage=new Array('/WebPages/DashboardPage1.aspx','/WebPages/DashboardPage2.aspx','/WebPages/DashboardPage3.aspx','/WebPages/DashboardPage4.aspx');
var cols = 2; 												//Number of columns for the charts table
// END OF CONFIGURATION

function getTitle(WP)
	{
	var guid = WP.getAttribute("webpartid").toUpperCase();
	var id = WP.id;
	var ctx = g_ViewIdToViewCounterMap["{"+guid+"}"];
		ctx = (!ctx)?{}:eval("ctx"+ctx);
	var title = id.replace(/WebPartWPQ/,"#WebPartCaptionWPQ");
		title = $(title);
		return (title.length==0)?guid:title.prev().text().replace(/\(Hidden\)/,"");
	};

function buildData(webPart)
		{
			$(webPart).find('td.ms-gb:contains(\':\')').each(function(i,e)
				{
				var MyIf= $(e).text();
				var unitNumber=parseFloat(MyIf.substring(MyIf.indexOf('(')+1,MyIf.length-1)); // Extract the 'Y' coordinates
				var unit= MyIf.substring(MyIf.indexOf(':')+2,MyIf.indexOf("(")-1); // Extract the labels
				var unitEntry = [unit, unitNumber];
				myData.push(unitEntry);
				});
		return myData;
		};

var ListViewArray = $('div[webpartid]:has(table.ms-listviewtable td.ms-gb)');
rows=1;
while (ListViewArray.length > cols*rows) rows += 1;
var html = '<tbody>';
j=0;
for (var r = 1; r <= rows; r++)
	{
	html += '<tr>';
	for (var c = 1; c <= cols; c++)
		{
		clickableCell=(j<ListViewArray.length)?'<div id=\"chart'+j+'\" style=\"cursor:pointer;\" onclick=\"window.open(\''+goPage[j]+'\',\'_self\')\"></div>':'<div id=\"chart'+j+'"><p>No Chart To Show</p></div>';
		html += '<td class="tableCell" col="' + c +'">' + clickableCell + '</td>';
		j=j+1;
		};
	html += '</tr>';
	};
	html += '</tbody>';
// console.log("html: "+ html);
$('#chartsTable').append(html);

for (j=0; j<ListViewArray.length; j++)
		{
		var myData= new Array();
		var container='chart'+j;
		var myChart = new JSChart(container, 'pie');
		myData=buildData(ListViewArray[j]);
		myChart.setDataArray(myData);
		myChart.setSize(350, 240);
		myChart.setPieValuesFontSize(9);
		myChart.setPieUnitsFontSize(9);
		myChart.setPieRadius(70);
		myChart.setTitle(getTitle(ListViewArray[j]));
		myChart.setTitleColor('#000000');
		myChart.draw();
		};

})(jQuery);
</script>
 Claudio Cabaleyro
MOSS 2007 – (almost) no-code solutions


Followed the article step by step, but right after I apply the content editor webpart disappers or hides somewhere I cannot find it. I am definitely missing something.
Great article, and thanks for taking the time and sharing with us.
Hi Claudio,
I have been using some various jQuery functions on our MOSS installation and have had some luck. I am not having much luck getting this to work. One question…When I look above at the text I am seeing a bunch of items that what appear to be extra semicolons;;;;. Is this correct?
Thanks for your feedback!
Jim
It looks like some of the code got messed up in the copy/paste. I see the same random semi-colons, Jim.
Hi Claudio
I have all the code pasted and the js script updated, but am unsure how the DASHBOARD CONFIGURATION works – still unsure what page address goes in there. I also see some other comments about the code, so is there something missing?
When I go out of edit mode, there is nothing there except my grouped list.
Iain
The code got bad on the initial transcription of the code, but people at EUSP will soon be fixing it.
Iain,
Let me try to better explain how this works through a simpler example: let us suppose that we want to build a dashboard page with only two charts, based on grouped list views “A” and “B”.
On the dashboard page we include two list view web parts and configure them to show view “A” and view “B” respectivelly.
On the other hand, we need to build two additional web part pages, one that includes the list view “A” and the other the list view “B”. Those two pages are actually the ones you should point to in the Dashboard configuration section of the code.
I hope this helps.
Claudio has sent us an update to the script and we have updated the script blocks. Please try again. — Natasha
As it seems the new code is working just fine!
Thanks
Morning
Got the new code – thanks.
Tried to do what you suggested and it is still not working.
What I think would be a good idea and hope Mark agrees, show us how to do this in a video file.
Until that happens, I guess I will sit down and try to figure out what I am doing wrong.
Iain
Iain,
Couple of things you could look for:
1. Strip all the http://wssserver for your jquery, jscharts and dashboard pages. The first two if you are using the local version.
2. Think of the dashboard pages as what pages do you want to show once the user clicks on the chart, Claudio is showing Dashboardpage1.aspx (stored in webpages doc lib), you could point it to the original view just strip out the http://..
Hopefully it will work for you.
This is great, I’ve put this to use on a site we have and is working beautifully. It does come with a bit of a performance hit, but it serves a practical function.
Just wanted to point out a typo on lines 24 and 25, the closing script on line 24 needs to be moved to be after the end of the comment on line 25.
This works great for lists where I have multiple group by items.
If I try to do this on a list where all the items have a status of “Not Started” which is the case if you are just starting out, then the charting webpart gives the following message “JSChars: Not enough data to render chart”. It needs more than one column.
Is there a way to render a complete circle (pie) if we all records in one bucket.
Thanks for the help.
Amit
I’m using jscharts in a custom web part that gets the data from a sql stored proc. The bar renders okay, except that there in no color. The values appear but the bars are empty. Has anyone ever seen this?
Hi there Claudio,
Wow this is pure brilliance – have tried it out, works well, slight performance hit. Only one issue though – when in page edit mode the titles show up at the top of the charts well. But, when the page is saved and back into read view the GUID is displayed instead – am checking out the code block:
var title = id.replace(/WebPartWPQ/,”#WebPartCaptionWPQ”);
title = $(title);
return (title.length==0)?guid:title.prev().text().replace(/\(Hidden\)/,”");
Am sure its something to do with the title coming back at 0 but could be very wrong here – any thoughts please?
Cheers
G
Wow, good work, Kudos to you man !!!
How can we open link in new window?
Can we stop random coloring? Everytime you run chart, it is displaying in different color theme? Is this possible?
How can we open link in new window – I found out these solution, it is my mistake, I have not read code properly, I made minor changes, I replaced
_self with _blank. It works as I am looking for
Now I am looking to sop random coloring in Pie chart
Hi Claudio,
Great post indeed.
I did run into a couple of issue though.
1. I had problem to have the graphs showing. After carefull and long test I found out that the Data it will be displaying cannot contain any special character, this was preventing the chart from displaying.
2. I still cannot get the chart to appear in a Table style (2 x 2) of different combination, any idea?
3. I would love to be able to freeze the colours, just something on my wish list.
again, great script.
>> when the page is saved and back into read view the GUID is displayed instead – am <<
Geoff Evelyn: I noticed this too. It’s not because your lists are hidden but because the chrome type on them is not set to Default (or other type showing title). Take a look at your webparts and ensure the Chrome is set to default. It can still be hidden but I was able to replicate your issue when I set the chrome type to “none”.
Hi
I want the gant chart,(vertically) which has only one line with two parameter (min, max). could you please send me the sample code on that one using jquery
Great work. Is there a way for any of the graphs, pie or bar that the title can be rotated? I am using this with a survey. Although the answers are omly 2 – 3 words they are overlapping each other. If there was a way to apply a inline style or css for layout-flow : vertical-ideographic;
that would be helpful.
Great code, but indeed: is there some way to stop the random coloring? This only seems to happen when using a pie graph. Bar shows only in blue.
Much appreciated!
I am trying to display pie chart for 3 different views of a list.
my problem is instead of showing separately all the 3 view’s are getting mixed up in single pie chart.
I want to display different status like “select”, “reject” & “pending”. which is same for the 3 views. but the column beign used is different.
please help me out in displaying all the 3 view in separate charts.
Thanks
geets
I am very interested in this post and corresponding code, but don’t see the details. I am wondering if the code was lost during the move of EUSP?
Roxanne – Please try again. Should be good to go. — Mark
I am wondering if there is an easy way to set the colors for the different chart. For example, Chart 1 needs to be RED, AMBER and GREEN, and Chart 2 Need to be 5 specific colors. Can that be done and where/how would I do that based on the values?
I was having problems getting this to work when i set the path directly to my document library, as /Scripts/jquery.js which did not work. I added my site name to the path i..e, sites/test/scripts/jquery.js and got this to work.
Hope this helps someone else.
Dean
All I can get to appear on the screen are 4 blocks of text that read “No Chart To Show”…
Any suggestions?
OK, I got it working with my custom views.
However I have an issue. When in “Edit Mode”, the name that appears at the top of my chart displays correctly, however, when I exit the “Edit Mode”, my chart name changes into a string of alpha-numeric characters.
How do I force my chart name to remain what it should be?
Question: For this particular list, I’ve defined an “All Items” view, and 4 custom views.
Is it possible to display the charts presented at the top of each custom view at the top of my “All Items” view?
Thanks!
Sorry folks, Guess I just needed to re-read the instructions a few times before it sank in :)
I have 4 pie charts displayed above my “All Items” list now.
The only issue that remains is the one I reported previously inwhich the title appears correctly at the top of each pie chart, but only while I’m in edit mode. When I exit edit mode, the title at the top of each chart becomes a series of alpha-numeric characters.
If you have any idea how I can resolve this issue, please let me know.
Thanks!
I too have the issue with the colors changing. I need “Active” always shown in Red, and no other data slice to use that color if there are no “Active” records.
I was able to get my charts to drop whatever color I wanted for a particular slice of the pie. What I did was replicate the fuction BuildData with BuildData0 which extraced only the Title (Red, Amber, Green for me). Then I created myColor variable that with an if Test assigned the color for the pie piece. Code is below:
<table id="chartsTable"> <tbody> </tbody> </table> <style type="text/css"> td.tableCell { background-color:#F5F5F5; border-style: ridge; text-align: center; } </style> <script src="../../javascripts/jquery-1.4.min.js" type="text/javascript"> // To load jQuery (redefine the path if necessary) </script> <script src="../../javascripts/jscharts.js" type="text/javascript" > // To load jsCharts (redefine the path if necessary) </script> <script type="text/javascript"> /* * WORKING VERSION 0.1 * Multiple Charts, with FusionCharts * By Joe Tobey */ $("document").ready(function ($) { // DASHBOARD CONFIGURATION var goPage=new Array('<link1>', '<link2>', etc.); var cols = 2; //Number of columns for the charts table // END OF CONFIGURATION function getTitle(WP) { var guid = WP.getAttribute("webpartid").toUpperCase(); var id = WP.id; var ctx = g_ViewIdToViewCounterMap["{"+guid+"}"]; ctx = (!ctx)?{}:eval("ctx"+ctx); var title = id.replace(/WebPartWPQ/,"#WebPartCaptionWPQ"); title = $(title); return (title.length==0)?guid:title.prev().text().replace(/\(Hidden\)/,""); }; function buildData(webPart) { $(webPart).find('td.ms-gb:contains(\':\')').each(function(i,e) { var MyIf= $(e).text(); var unitNumber=parseFloat(MyIf.substring(MyIf.indexOf('(')+1,MyIf.length-1)); // Extract the 'Y' coordinates var unit= MyIf.substring(MyIf.indexOf(':')+2,MyIf.indexOf("(")-1); // Extract the labels var unitEntry = [unit, unitNumber]; myData.push(unitEntry); }); return myData; }; function buildData0(webPart) { $(webPart).find('td.ms-gb:contains(\':\')').each(function(i,e) { var MyIf= $(e).text(); var unitNumber=parseFloat(MyIf.substring(MyIf.indexOf('(')+1,MyIf.length-1)); // Extract the 'Y' coordinates var unit= MyIf.substring(MyIf.indexOf(':')+2,MyIf.indexOf("(")-1); // Extract the labels myData0.push(unit); }); return myData0; }; var ListViewArray = $('div[webpartid]:has(table.ms-listviewtable td.ms-gb)'); rows=1; while (ListViewArray.length > cols*rows) rows += 1; var html = '<tbody>'; j=0; for (var r = 1; r <= rows; r++) { html += '<tr>'; for (var c = 1; c <= cols; c++) { clickableCell=(j<ListViewArray.length)?'<div id=\"chart'+j+'\" style=\"cursor:pointer;\" onclick=\"window.open(\''+goPage[j]+'\',\'_self\')\"></div>':'<div id=\"chart'+j+'"><p>No Chart To Show</p></div>'; html += '<td class="tableCell" col="' + c +'">' + clickableCell + '</td>'; j=j+1; }; html += '</tr>'; }; html += '</tbody>'; // console.log("html: "+ html); $('#chartsTable').append(html); for (j=0; j<ListViewArray.length; j++) { var myData= new Array(); var myData0= new Array(); var myColors = new Array(); var container='chart'+j; var myChart = new JSChart(container, 'pie'); myData=buildData(ListViewArray[j]); myData0=buildData0(ListViewArray[j]); for (var z = 0; z < myData0.length; z++) { if (myData0[z] == '01 RED ') { var myColor='#FF0000'; myColors.push(myColor); } else if (myData0[z] == '02 AMBER ') { var myColor='#FFC000'; myColors.push(myColor); } else if (myData0[z] == '03 GREEN ') { var myColor='#008000'; myColors.push(myColor); } else if (myData0[z] == '00 GRAY ') { var myColor='#C0C0C0'; myColors.push(myColor); } } myChart.setDataArray(myData); myChart.setSize(350, 240); myChart.setPieValuesFontSize(9); myChart.setPieUnitsFontSize(9); myChart.setPieRadius(70); myChart.colorizePie(myColors); myChart.setTitle(getTitle(ListViewArray[j])); myChart.setTitleColor('#000000'); myChart.draw(); }; })(jQuery); </script>Sam…I was able to do what you are asking, but I am unable to post my script to the board.
Joe – Send it to me and I’ll get it posted. — Mark
Thanks Mark…it finally posted. Must have been a delay with its size.
Joe,
I do have page where I am using Claudio’s script, I replaced it with yours. Changed the reference to jquery and jscharts appropriately but it doesn’t work for me.
Did the wordpress lose some of the formatting on your javascript?
The script looks right to me.
What I would suggest is adding some javascript alerts to the code to see where it is breaking. That is what I did, and found a reference to & vs. having &.
So for example, just to make sure things are getting called to start with:
alert(”jquery call executed”);
// To load jQuery (redefine the path if necessary)
alert(”jscharts call executed”);
Then in the main script, alert variables that are being created. If there is a code error, then the alert will not happen, you can start searching there.
Hope that helps
Joe – thanks – your troubleshooting technique helped. I had an extra period in the link array — feel like a goof ball.
The charts are rendering but I am using this on task list but I am getting the following warning:
JScharts: Colors array length must equal data length in case of pie and bar graphs
Thanks for your help !
Amit
Amit –
Make sure that the number of colors you are using matches the number of items that you are graphing. For example, if your chart has 2 items (Amber and Green) and you make a reference to Red also, then that error will produce, or if you only have 3 colors and 4 items.
So do an alert on myData and myColor and make sure that you have everything insync.
myData should look like this:
(’Item1, #”,”item2, #”,…,”itemN, #”)
myColor should look like this:
(’Color1, #”,”Color2, #”,…,”ColorN, #”)
If you don’t care about the colors, I would remove all code related to myColor and BuildData0.
Hope that helps
Hi Joe,
Is it possible to nest the colors eg set up the code such that if there is only 1 segment, then use #FFFFFF, if there are 2 segments then #FFFFFF, #FFFCCC etc so that 6 segments would actually have 6 colors listed.
I know what I want just do not have the skills or knowledge of the code to make it happen.
Thanks in advance
Hi,
This is EXACTLY what I want to accomplish, but I seem to have the GUID show up instead of the title. I reviewed the comment about about Chrome setting, and it’s Default. Any suggestions? So close, but not 100% yet.
The title of the pie charts appears correctly at the top of each pie chart, but only while I’m in edit mode. When I exit edit mode, the title at the top of each chart becomes a series of alpha-numeric characters. Please help to resolve.