
KPI Dashboard for WSS: Part 1 – No code required
A few weeks ago Chris posted the following problem on Stump the panel:
We want to display KPI indicators with each item (green if we met the target, yellow almost, red not even close). I’ve been using Visual Indicators for the Masses: KPIs in WSS. So I setup different lists for each one, So in financial the target/actual is set to currency. In customer loyalty it’s a number etc. This was working fine until today, when I got to see more of the real data. I learned under financial that the target/actual could be sometimes a $ amount, or it could be a count, or a percentage!!!
Well, this is a common situation in the IT field, requirements change as we go :). The problem seemed interesting and Chris and I worked together to solve it. The final solution looks like this:
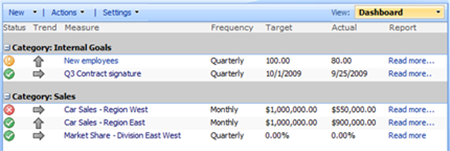
This is a simple solution. It does not require code deployment and it works on WSS. You only need some time and patience to build everything.
In order for everything to work you need 5 custom content types, 4 of these are being listed under New menu.
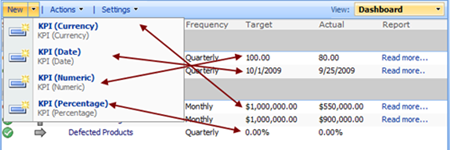
By selecting one of these the user will be taken to a different form that requires him to enter data in a particular format e.g. numeric, date, currency or percentage. You can use different validations or some custom fields for each of these content types. In this example we have used additional meta-columns: category, frequency, trend and report. In order to display and format all of these I used the Data View Web Part and custom XSLT stylesheet.
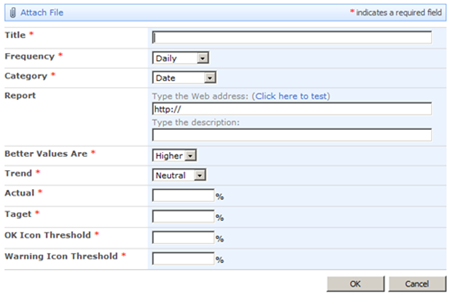
The KPI item input form allows the user to set a lot of options to each KPI. The interface is similar to one of SharePoint Enterprise KPIs but you can use this on WSS.
Content Types structure
When building solutions like this one, the most important part is to plan your Content Types ahead of time. To fulfill Chris’s requirements I had to build 5 content types as shown in the picture below:
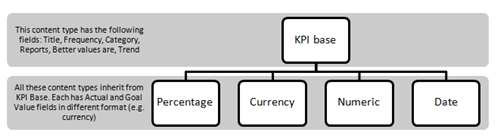
The KPI Base content type holds fields that are common for each subsequent content type. All “child” content types inherit base columns from the KPI base and each adds something unique. The percentage column adds to the Goal and Value columns that are percentage type, numeric adds numeric fields and so on.
Although inheriting content types might sound a bit complicated the most important benefit is much easier maintenance. If you need to add some additional meta-data columns to all content types you only need to change base content type and all of the child content types will be updated. It also gives you flexibility in case you plan to modify child content types.
Implementing this solution
Implementing this solution to your environment is quite easy. Just upload this list template to your SharePoint site, choose Create from Site Actions, select KPI Dashboard template from the Custom templates section. This template will automatically create the content types I mentioned above and the Dashboard view for your KPIs.
Conclusion
Although implementing a KPI dashboard like this one might look complicated it is not. By using the Data View Web Part you can create your own dashboards plus extras. The solution does not do anything special (only displays colorful icons) but your managers will love it.
In the next post I will provide more details on how to build Content Types step by step and provide details on how to implement XSLT stylesheet for your Data View.
Personal geek note: I wrote this blog post using Word 2010 (Technical Preview)
 Author: Toni Frankola SharePoint Use Cases Toni started his Web adventure in late 90’s and has been working with various web technologies ever since.
Toni is leading project engagements and managing a team of consultants specializing in Microsoft technologies. His primary focus is on Microsoft Office SharePoint and Dynamics CRM. He works at Perpetuum Mobile, a Microsoft Gold Partner from Croatia.
- KPI Dashboard for WSS: Part 1 - No code required


Confirm by “environment” as in Implementing this solution to your environment is quite easy. that the KPI discussed above is in the ENTERPRISE edition only.
@IdoSP: No, this solution is designed for WSS. You do not need anything from Enterprise nor SharePoint Standard edition. Pure WSS 3.0. :))
Cannot wait to read the next part – you absolutely rock Toni.
The icons are not diplayed. They are not in the images directory
I have some trouble with the values. When I put 50% in actual it change after saving to 500% ?????
Sorry for being so anal about this but in the paragraph Implementing your solution you mention creating a new library. I’m guessing you mean List instead. Again sorry it’s just I find users have a hard time figuring out the difference between the two and use the names rather interchangeably. Otherwise great post!! I’ve been looking for something like this (maybe should have started with that:-) )
Thanks for this solution, the images are missing though :-(
Images are showing up fine on my end. They might be blocked on your end. Check with IT? — Mark
The image have to be copy in the images directory on the main site.
About the field ‘Taget’ is it a misspelling of Target?
The xsl format of the percentage value is not good for european number format.
I am looking forward to seeing the next installment. Very promising so far!
Sorry guys, I took few days of, but here are your long awaited replies.
@amit, ben: thanks will be up soon.
@Michal: Fixed
@Roland: I will check these and let you know.
@all: I am using default WSS images from “x:\Program Files\Common Files\Microsoft Shared\Web Server Extensions\12\TEMPLATE\IMAGES”. These should be in every WSS installation.
This is great, thanks for posting it!
I’d like to be able to link a KPI dashboard to an Excel spreadsheet, so we can keep detailed records of our monthly performance and quickly pull out a summary on our intranet. I have in mind something like this without needing Sharepoint Enterprise: http://bit.ly/1RQLxb
Is this very much more work?
Tom – Take a look at this: http://www.endusersharepoint.com/?p=1883
Mark
@EndUserSharePoint great, thanks!
Hi, I’ve installed the template on our WSS site. When I try to create a site i get the following error:
The template you have chosen is invalid or cannot be found.
Any assistance with solving this would be greatly appreciated.
Amar
Hi, I figured out that the KPI template only works on WSS version 2. Do you have a WSS 3 (WSP) vesion of the KPI template?
Thanks.
@Amar: This is for WSS 3.0, which version do you have?
WSS 3.0
I’m having the same problem as Amar, when I try to create the site I get the invalid or cannot be found. Any suggestions?
I am also having the same issue as Amar and Tony Proctor. Our environment is WSS 3.0 on Server 2003. I’m unable to create a site using the KPI template – invalid or cannot be found error.
Same issue.
I try to install it on a MOSS 2007 DEV farm, with WSS 3.0 SP2, with cumulative update June 2009.
Cheers.
Note: I used “stsadm -o addtemplate” to add it to the system.
I also got two language installed: English and French.
I made a test create a site using the French “version” and the site was created!
Using the “english” pulldown, I got the ”
The template you have chosen is invalid or cannot be found.” message.
Ok we figured it out. You also need to create the content types.
@Tony: The list template should create content types automatically. This might not happen if you have content types of the same name, or you do not have proper rights to create content types.
Hi there,
I’ve uploaded the site template and found this to be a great solution. I’m trying to recreate this but I can’t get my head wrapped around the content types that you created. 2 Questions:
1) Where is the KPI Base content type? Your diagram of the 5 content types makes sense, but I don’t see the KPI Base content type. It looks to me like the other 4 content types just inherit from the base ITEM content type.
2) How did you create the other 4 content types so that I do not see them as Site Content Types? These seem to simply be List Content Types. When I try to create similar content types, I’m forced to create them at the Site Level.
Thanks,
david
3rd Question, sorry:
3) How did you create List columns by the same name? I see this error:
—————————
Windows Internet Explorer
—————————
The column name that you entered is already in use or reserved. Choose another name.
—————————
OK
—————————
Tony,
How you have applied the images for status/ trends in the DataViewWebpart for Dashboard view.
Hi there,
I have the same problem as Roland. When I put 50% in actual field it change after saving to 500%. Is there a solution to this problem?
Thanks, Fredric