
SharePoint: Interactive Charts using Google Visualization API v2.0
 Guest Author: Alexander Bautz
SharePoint JavaScripts
14.09.2010 Small update to the code to fix the “Initial state” in motion charts, as well as some minor bug fixes. I have moved the files to my home server for you to download. This provides a better solution then manually highlighting and saving 2000+ lines of code. Please note that the file now come in three different “versions”. Read more in the “download section” below.
09.09.2010 Small update to the description regarding update from v2.0 to v2.5. I forgot to mention another field required to be added to the Chart configuration list: ListBaseUrl. This in addition to the already mentioned “ChartFormatters”. I have also removed an alert that was left in the code (line 40).
Christophe notified me of a problem with the 2010 compatibility in sub-site “homepage” – which is a wiki page. The CEWP HTML handling in SP2010 is a bit “different” than in SP2007. When editing the HTML source code, it actually pulls the contents generated by the script into the edit dialog and does not use the content that was originally saved to the CEWP… This is a bit of a headache!. A workaround for the wiki-pages is to use the “Content Link” property for the CEWP and link to a .txt file with the CEWP code placed in a document library (alongside the other scripts).
06.09.2010 Updated the script “ChartUsingGoogleVisualizationAPI.js” and the CEWP code. The version number is notched up to 2.5 and the changes are:
- Added the ability to chart data from all ascending parent sites and all first level subwebs of current site
- Added a few formatter options in the UI – refer the linked resources for instructions (thanks to Paulo for the tip).
- Added new “action” for formatting as % (value*100).
- The solution is now SharePoint 2010 compatible
- Enhanced the UI for editing charts – all options and columns are now directly editable.
- No more need to specify the “userListGuid” and the “userListBaseUrl” in the CEWP code.
- The naming of the charts in the Chart Configuration list is enhanced – it now prefixes the chartId with “location.pathname” to prevent overwriting an existing chart when reusing the CEWP code in another page (thanks to Christophe for the tip).
- Edit chart is now done in the standard “Browse mode” and not in “EditPage mode”. The edit button is found in the top left corner of the chart. The button is only visible for users with “Edit page rights” and does not show on printouts.
- And more…
Note: This update introduces a new column in the configuration list (GoogleVisualization_InteractiveChartsConfig). To reuse the existing Chart configuration list you must add one field of type “Multiple lines of text (Plain text) named “ChartFormatters”. Optionally you can delete the Configuration list and have this solution automatically recreate it for you.
Please note that the CEWP code has changed alongside the code for the file “ChartUsingGoogleVisualizationAPI.js”.
Note about existing charts:
All your existing charts will need to be updated with the new “page id” in the chart configuration list (GoogleVisualization_InteractiveChartsConfig). Look at the new configuration item that is automatically added – copy it’s name and update your existing chart configuration – while deleting the newly added (empty) chart configuration.
Since I posted the previous version of the solution that utilizes the Google Chart Tools / Interactive Charts (aka Visualization API), Google has updated their API and made the previous version more or less obsolete.
NOTE:
I have made a “bridge” between Google’s Visualization API and SharePoint. How the charts render or function is up to Google to decide – it is their “product”. Refer to the various configuration options by following the link from the “Edit chart UI”.
Read Google’s terms of Use here.
Google’s Data Policy on these charts:
All code and data are processed and rendered in the browser. No data is sent to any server.
This new release features these chart types:
Area chart | Bar chart | Column chart | Gauge | Geo Map | Line Chart |
Map | Motion Chart | Organizational Chart | Pie chart | Scatter Chart | Table
Other modifications made:
- All code in one file: “ChartUsingGoogleVisualizationAPI_v2.0.js”
- In the CEWP: Refer to the above file, jQuery (fixed external link) and the Google jsapi (fixed external link)
- Chart configuration list is automatically created if it is not already present
The solution is tested in IE8, Google Chrome 5.0.375.127 and Firefox 3.6.8.
Some screenshots:
Not all chart types are presented.
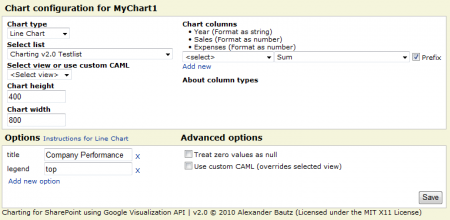
When first adding a chart CEWP to a site, the configuration list is created:
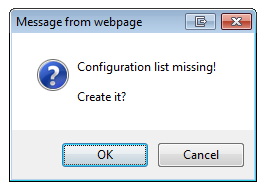
Press OK:
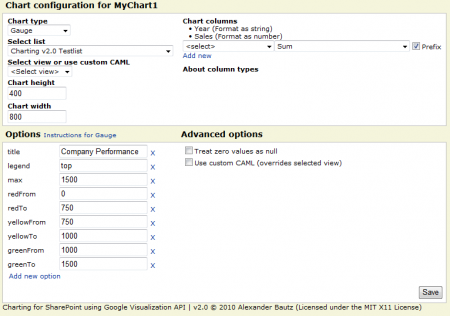
Gauge – a good KPI:

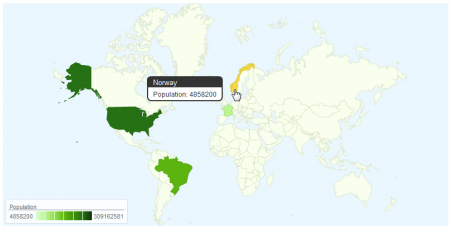
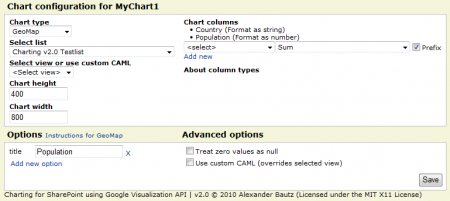
GeoMap
Column chart – counting unique values per country:
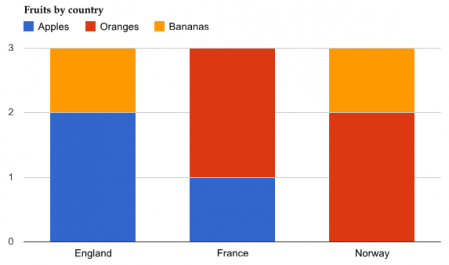
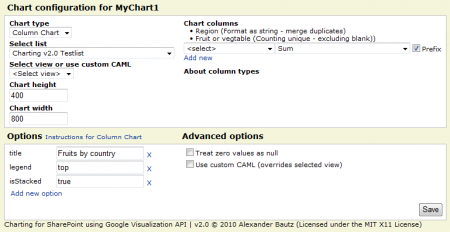
This chart type merges all “lines” where the country is the same, counting “fruits” in the choice column named “Fruit or vegetable”.
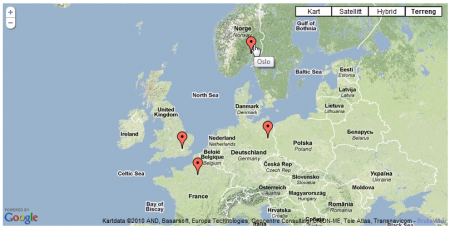
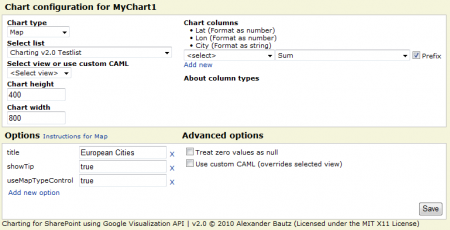
Map:
Motion Chart:
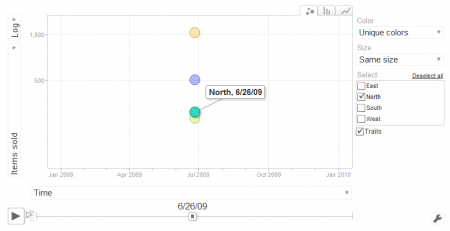
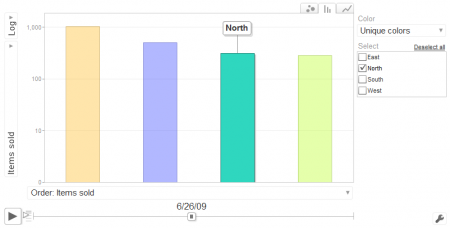
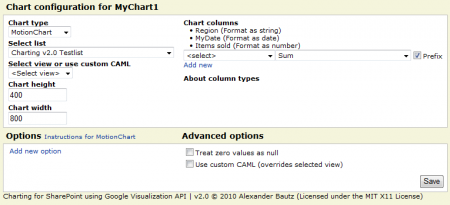
The “date” column can be a SharePoint data-column, or a “US formatted” string (still formatted as “Date in the UI”) in the format “mm/dd/yyyy”. Refer to the “Instructions for MotionChart” link in the UI.
Organizational Chart:
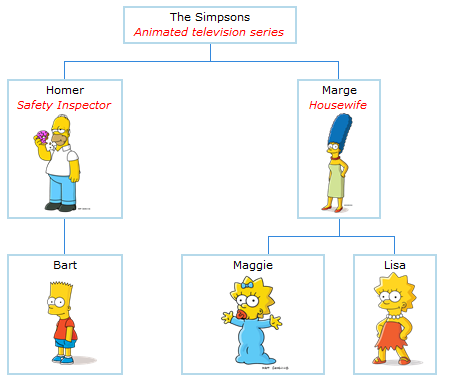
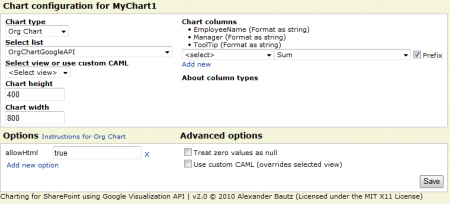
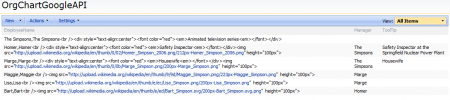
This is the data that makes up this chart. Note that it is built with various calculated columns – no need for it to render as HTML in the list – it is “raw data”.
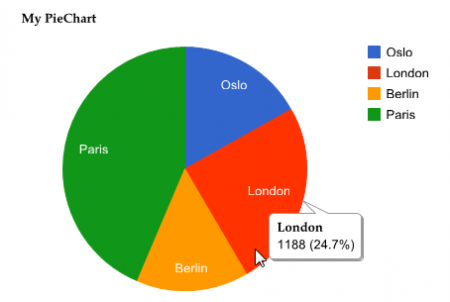
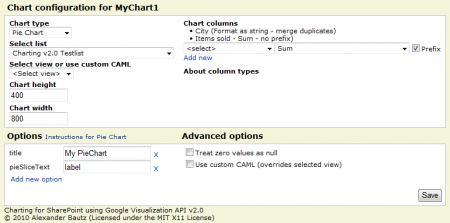
PieChart:
More examples – including custom CAML-queries will be added on request.
The Code:
This is the CEWP code:
<div id="MyChart1"></div>
<script type="text/javascript">
/*****************************************************
		Address all containers
*****************************************************/
// All charts must be represented by a container with a unique id. This container  must be present in the page
arrOfChartContainers = ["MyChart1"];
</script>
<script type="text/javascript" src="http://ajax.googleapis.com/ajax/libs/jquery/1.4.2/jquery.min.js"></script>
<script type="text/javascript" src="http://www.google.com/jsapi"></script>
<script type="text/javascript" src="/test/English/Javascript/ChartUsingGoogleVisualizationAPI.js"></script>
The placeholders can be inserted in other CEWP’s as long as they render before the chart is initiated (place them above the “Chart CEWP”).
It is essential that the scripts tags for “jsapi” and “ChartUsingGoogleVisualizationAPI.js” are placed below the script tag that defines the “arrOfChartContainers”.
The code for the file “ChartUsingGoogleVisualizationAPI_v2.0.js”
This link provides you with three different “versions”:
- ChartUsingGoogleVisualizationAPI_vX.Y.Z.js – Uncompressed code
- ChartUsingGoogleVisualizationAPI_vX.Y.Z-min.js – Minified using YUI Compressor to reduce the file size
- ChartUsingGoogleVisualizationAPI_vX.Y.Z-packer.js – Compressed/obfuscated using Dean Edward’s Packer to further reduce the file size
You must update the script name in the CEWP to reflect the version number.
Note:
When new versions are released, they will be placed in a folder with the version number as label. Be sure to download the latest version.
If you are using a browser other than IE, right click the file and select “Save link as” or “Save linked content as…”.
Tip:
To make it convenient for end users to use this charting tool, create a few CEWP’s with your favorite setup (1 placeholder, 4 placeholders in a table form and so on). Export the CEWP and upload it to your web part gallery (in the root of the site collection).
You can now add it as a regular webpart from the “web part selector” in edit page mode.
Enjoy!
Alexander
Guest Author: Alexander Bautz
SharePoint JavaScripts
Alexander Bautz is a SharePoint consultant/developer (mainly JavaScript/jQuery solution) living in Norway. Alexander spends a lot of his spare time blogging on the same topics. His focus area is "end user customizations" with no (or as little as possible) server side code.


WOOOOW!! That is flat out amazing. Thank you so much for writing this up and sharing it with the community. The screen shots really bring it to life and help show the potential business value. GeoMap would be a great way to visualize that data type and I believe Google Maps is by far the best here.
I will have to download the .JS and give this a try.
Thanks for sharing this amazing script to us End Users Alexander.
I just tried it out and it looks real great!
Hi,
I’m glad you liked it :-)
This is a cross post from my blog
I do not have edit access to this article, so please check the original article over at my blog for the most recent updates.
There has been reported and fixed a bug regarding “chart options” using object literals.
I will release bug fixes and enhancements during next week, and this article will stay “one step behind” as i must notify my contact here at EUSP for her to update this article when i have posted updates.
The next release that brings in new feature will most likely be posted during next week.
One of the new features will be the ability to chart data from all ascending parent sites and all first level subwebs of current site.
Alexander
Great article!
Is it supported in SharePoint Foundation? It looks great and Im now trying to make it work on a wikipage within a CEWP, but its not??? Any idea how I can make it work? Or do you have more detailed instructions anywere?
Yes, with the v2.5 it is.
Alexander
Alexandar,
Works like a charm! Truly brilliant coding.
I was wondering if we might have more opportunities to change the font, color, etc. for the different chart types from the CEWP interface?
Oh I figured it out. Just add an option with the name of the parameter.
I have gotten this implemented but I am wondering if there is a way to specify the colors of the lines or bars on the chart. I know there is the option for colors but I cannot seem to get it to work.
Hi,
It is supposed to support all “options” available in the Google Chart API. What code is it you you cannot get to work?
Alexander
It is not code per say but more just the option for colors: Under configuration options there is a line listed for:
colors | Array of strings | default colors | The colors to use for the chart elements. An array of strings, where each element is an HTML color string, for example: colors:['red','#004411'].
Within the CEWP in the edit page view I click Add new option. for Option Name I type in Colors, for value I try typing in a string of colors but then nothing happens when I save.
Hi,
I have no problem using the “option” you provided
Option : colors
Value: ['red','#004411']
Please send me some screenshots – you find my email in the top of the code.
Alexander
Fixed with your answer! Thanks!
I must be missing something – I can’t get this to work. I added a CEWP to a list, added the code and the file link but I don’t get anything. I have been successful with color coding lists, hide fields, etc. Is that all I’m required to add? Any help would be greatly appreciated.
Hi,
Please verify that your file is saved with a .js extension and that the link in the CEWP is correct
PS: Save it in UTF-8 format (no biggie but there was a corrupt (c) in the copyright statement caused by ANSI format).
Alexander
It looks fantastic. Absolutely genius!
With that said, I am obviously not the one as I can’t get it to work. The “.js” script is on the site, referenced in the CEWP at the bottom of the page. Another CEWP with code is up top… Nothing shows up. Your script shows in both webparts or am I missing something?
Any help would be greatly appreciated
Anyway, THANK YOU
K
HI,
I’m not sure what you mean by “The “.js” script is on the site, referenced in the CEWP at the bottom of the page. Another CEWP with code is up top…”
Try using the provided CEWP code-sample. Modify the script src for the file “ChartUsingGoogleVisualizationAPI.js”.
Does it work?
Alexander
Alex,
So what I mean is:
1. I have two CEWP on the page. One (placeholder) has the following code:
Another one, positioned at the bottom of the page, has the following code:
/*****************************************************
Address all containers
*****************************************************/
// All charts must be represented by a container with a unique id. This container must be present in the page
arrOfChartContainers = ["MyChart1"];
”
And nothing happens other than the message on the top CEWP when not in Edit mode: “Table has no columns”
Thank you,
Kirill
Hi,
Read here how to post code in comments
Please repost the code.
Alexander
hello
Sorry for my bad English, but I’m french …
First a big congratulations and thank you for this script is great, everything is OK
I use the chart type “Line Chart” and I would just like to know if it is possible to display values at each point in the graph or on the last point and not just passing the mouse cursor
Thank you for your answers
Daniel
Hi,
I repeat my answer as i wrote over at my blog:
Hi Daniel,
Your English is perfect – keep in mind I’m Norwegian!
I cannot help you with your request as the charts are created using Google’s Visualization API, and it currently does not support this option.
I hope they will make this possible in future releases, and if they do, i will implement it in this solution.
Alexander
I had used Google Visualization gadget to display international offlice locations for a company around the globe.
Here is the link:
http://mohantaneja.blogspot.com/2010/06/visually-stunning-map-with-color.html
Copy and paste the code in a CEWP.
Note:
Have written comments in the javscript code to explain all the methods and parameters.
– Mohan
Alexander,
Hi. I am still trying to implement your “bridge” between Google’s Visualization API and SharePoint. As you may recall, I am the one who is trying to accomplish this with SharePoint 2003. (Sorry but I work for the government and that is what I have to work with.)
Anyway, I couldn’t get your version 2.0 to work so I am trying to use your most recent version, v2.5. I would greatly appreciate it if you could answer these questions:
1) Does the CEWP code only contain 11 lines of code now? (I don’t see any reference to the SharePoint list/data source for the CEWP?)
2) Does the CEWP(s) have to reside on the same page as the list?
3) Are the “interaction.js” and “stringBuffer.js” scripts still needed? Or is “ChartUsingGoogleVisualizationAPI_v2.6.1.js” the only script needed under the /test/English/Javascript” document folder?
4) When I try to run “ChartUsingGoogleVisualizationAPI_v2.6.1.js” I get a Windows Script Host error for Line 1, Char 1, Code 800A1391″. Any idea what is causing this? (I am using Explorer 7)
I am not a programmer by training, so please forgive all the questions. Thank you in advance,
Tom
Hi,
Q1: No more need for referring other lists
Q2: The data is pulled in using a webservice call. The CEWP has to be in the page where you want the chart to display, but the list itself can be anywhere within the site collection.
Q3: No more need for these.
Q4: Not sure, but update to v2.6.3 as v2.6.1 and v2.6.2 had some bugs.
Alexander
Hi Alexander,
Did you get it working in SP 2003? I’m attempting to do the same with one issue so far. Please see my comment of 21/01/2011 for details
Alexander
I’m running IE7 on version 2.6.4. It seems the bridge is working partially: creates the list but stops and gives me an alert:
‘The package “()” is NOT loaded.
Review the CEWP code and add the chart type to the packages array.”
Can you assist?
DD
Hi,
Did you create the list using v2.6.4 or earlier version? – refer the version comment where you downloaded this version.
Alexander
I used the 2.6.4 version for creating the list.
DD
Hi,
Look at the latest release (v2.6.5). It is not supposed to fix this issue, but still…
Take a look at the Chart configuration list – find your “chart” and delete the list item. It will be recreated when you refresh your chart. Maybe it fixes your problem.
Alexander
I have released a new version (v.2.6.5). This intends to fix an empty web selector for those on a managed path.
Please test it and let me know if it fixes this issue or not.
Alexander
Alexander.
I used the new version (v.2.6.5), but still appears the legend of “Table not has columns”, I am using Sharepoint 2007. I have checked the creation of the list is correct, has all the variables with their respective specifications.
Would request your support in order to solve this problem called “Table not has columns”
Sorry but my English is very little. Thank you very much.
César H.
Researching on the problem of “Table has no columns”, and using HTTP Debugging tool, it identifies in / _vti_bin / list.asmx with error code 500, which reads:
soap:ServerException of type ‘Microsoft.SharePoint.SoapServer.SoapServerException’ was thrown.Value does not fall within the expected range.
Requested their support and indicated that I am working with sharepoint2007.
Greetings.
Hi,
Look here for a screenshot of the “error”
It is at the bottom of the article.
It is in fact no error as it is the initial state when you create a new chart.
I suspect that your problem is that the image that enables you to enter the edit chart GUI is not rendered. Can you provide some details on which site you are adding this chart to? – is it a MOSS publishing page?
If the problem is the missing image, please edit the script and change line 20 from:
hasEditPageRights = $(”*[id$='_MenuItem_EditPage']“).length==1;
to
hasEditPageRights = true;
I will update the script in the next release to fix this issue.
I have some problems with the server that hosts the scripts, so please use this url to obtain updates
Alexander
Alex has been of great help. He actually took time responding to my emails and we got the issue with MOSS 2007 Publishing pages resolved. I am using the charts to manage and report progress on a huge project with close to 200 resources actively working on tasks around the world. It works like a charm
THANK YOU
With respect,
Kirill Karmi
Kirill – This will make a GREAT case study if you can put together an article with screenshots. Seeing how Alex’s solution looks in the “real world” will be extremely helpful. — Mark
Unfortunately, the screenshot and detailed description piece is not going to work due to some legal restrictions I am working under. But I can tell you that:
We are deploying and configuring agents on close to 1000 servers. Each server can be addressed as a project as it will go through 6 steps (Validation, Push, Configuration, Testing, Migration and Production) with a logical workflow for each and every one of those steps (Not Started, In Progress, Passed or Failed, Out of Scope). The work is performed by tens of offshore resources all working on SharePoint to update the progress of their personal scope, report issues and such. I have created a Management Dashboard showing overall progress by Application (the deployment covers 3 major organizational solutions) – Gauge charts and by deployment progress in every area (Bar Chart). The information is being plotted from SharePoint lists. My management is absolutely flabbergasted, I can tell you that
Hi,
I have some trouble with the DNS for the server where i host the scripts. Please use this link until i get it sorted out
Alexander
And there it was fixed already!
Alexander
Hi, Alexander, Great Work.
Have installed your solution. works fine…
but unfortunately: Editing the chart to change something the List field is empty. When I try to sleect a list i only got some other stuff like
…
Reporting Metadata
Reporting Templates
MYCompany SharePoint Site
…. ….
After saving the editing job without any changes the chart is empty. Looking at the config file for this list der LIST GUID was gone.
The select site rolldown was always empty,
the select list rolldown shows the above mentioned choices, but no lists.
Deleting the config for this list and restarting works always, but only for the first edit of a chart.
Any Ideas?
Kind regards
Michaek
Hi,
Look at the newest release (v2.6.6) as it is intended to fix the site selector issue.
Alexander
Sorry, just read your blog after posting the part above.
2.6.4 works with the list selectio, also i can see this site up/down arrows at the select site rolldown (nothing there with 2.6.5)
Will need some try and error test to understand all capabilities.
Thanx again
Michael
Hi,
As you have read, i have some trouble with the site selector. v2.6.5 ONLY works for site collection administrators.
v.2.6.4 breaks if on a managed path…
I’m working on an update to fix this.
Alexander
This is a great tool for me, thanks! I know very little about any kind of coding, but I was able to follow your instructions and get it working. I am using a column chart to display quantities over time. Is there any way I can setup a drop down that will allow users who come to my site to select what columns they want to see? For example: I have info on the quantity of apples, oranges, and bananas delivered every week. But they want to just see apples. Is it easy to add a pull-down to select just apples that will automatically refresh the chart? Thank you.
Hi,
This would be possible using the motion chart that has this feature built in. Other than that it is not possible.
Alexander
I’m trying to get this setup on a simple web page that I’ve built from the ground up. I just created a blank .aspx page and added a web part zone. Then opened the page and added the code above into a CEWP. I changed the reference to the ChartVisualisationAPI.js to my own stored in a Doc Library. I know all of these references work fine because when I inspect the DOM, I see them getting loaded. My problem lies in the last line of code:
strArr.push(”<input style='width:100px' id='"+config.myChartId+"_ChartWidth' va
I'm getting this error below. Can you help me fix this?
Uncaught SyntaxError: Unexpected token ILLEGAL
Nevermind Alexander. The copy and past cut out about 300 lines of your script.
Thanks for sharing your hard work! I’m going to go get a raise now :D
Hi,
Glad you liked it :-)
Alexander
I have updated the script to v2.6.6 as v2.6.5 unintentionally made it impossible for other than site collection administrators to select site. This update fixes this issue.
For uses that are not site collection administrators, the loading of the site selector may take a few seconds extra.
The check for edit page rights has been removed due to feedback from users that had problems editing charts. To restrict editing of the charts, manage user right for the configuration list – all users must have at least read access!
Alexander
Hi Alexander,
has downloaded 2.6.6.js and put it at a document library at my subsite.
Editing an existing graphic (made with 2.6.4) ask apporx 5 or 6 times for user/password, then starting the editor view.
Unfortunatly it show only the company parent site http://portal.mycompany.com instead of my subsite
http://portal.mycompany.com/Testsubsite
After that I am not able to chosse lists from my sub, I can only, if existing there, use lists from parent.
Sorry for this issue :(
Kind Regards
Michael
Hi,
I need some more information…
Are you site collection administrator?
Do you have access to all subsites when you browse using the web browser?
Does your site reside on a managed path?
I really thought i had nailed it this time…
Alexander
Hi Alex, I have the same issue…I can only choose from lists in the parent site even though I have site collection privileges and I am using v2.6.6. I always get this message….
“A column is missing in the Chart Configuration List. Refer the change llg in the original blog post to add the missing field. Optionally you can delete the Chart configuration list and have it automatically recreated.
The chart cannot be saved until this issue is fixed.”
I did delete the chart configuration list but no luck. I was wondering if you were working on a new version for site selection and associated lists?
Oh, I was able to solve the issue by deleting the config list, then re-creating it with 2.6.6, and then chaging the path to use 2.5.4 instead. Working well now.
2.6.6 looks good though — again, incredibly impressive technique!
Thanks
Dan
Hi,
I still have these issues with the site selector and even though all is OK in my testsites – both as site collection administrator and not, users still experience various errors. I posted v2.6.7 last night which tries out one small fix.
Could you test that version and let me know if it does any differences?
Alexander
Please look at v2.7 and let me know if it works better.
Alexander
Hi,
first trial to answer your Questions:
No
Yes
must ask the IT-colleague
In other words: I will come back asap after talking with the professionals.
Thx a lot
Michael
Hi, back again.
Portal Admin colleagues tested with his privileges my setup. His reply: Did work without questions for name/password and show functional content at the dropdowns..
So we will check my user rights during next days.
Regards
Michael
Look at the comment above regarding v2.6.7 – could you also test that one?
It might not do any difference, but i cannot recreate this error myself and need your help to try out different approaches.
Alexander
Hi, Alexander
2.6.7 tested, still asking for password, show only portal main site.
didnt help to host jquery and 2.6.7 local.
deleted the old (previous) chart.config file…didnt hel, setting up an new chart always stay at the main site (portal.mycompany.com)
btw: with .4 there was two small arrows for up and down with the site selection, they disappears with .5 and greater (!?)
Thanx for support.
Kind regards
Michael
Hi Alex,
2.6.8 works perfectly in 2010! This is a work of genius and it is really kind of you to share this with other Sharepoint users.
Thank you again!
Dan
Look at v2.7 – it intends to fix the web selector issue for non site collection administrators.
Alexander
Hi Alexander!
Great work! Thanks for sharing!
Can I use it with XML/RSS feeds instead of Sharepoint lists?
Zsolt
Hi,
That is not possible, sorry.
Alexander
2.6.7. worked for me. The result is my site collection has a real punch. Thanks for sticking with this project.
Great job.
I did experience one glitch however: I added some html to an org chart similar to that shown in the Org Chart example however it didn’t render…just got the text. I tried as both a calculated column and directly in the list. Is there some other script or other things that need to be added to get the html to actually render?
Hi,
Did you set the option “allowHtml” to “true”?
Alexander
Duh….thanks.
And thanks for being patient.
DD
I have published v2.7 of the script – as this is a cross post and i do not have edit access, here is the “change log”:
This version is the final fix (i hope…) for the web selector problems for non Site Collection Administrators (SCA).
For SCA’s there are no changes, but for those not SCA, I have abandoned my attempt to auto populate a web selector and gone for a input field. The user must write the URL of the web to load the list collection from. The reason for this is the fact that the method “GetAllSubWebCollection” is not accessible to non SCA’s, and that the manual iteration trough all webs caused prompts for credentials as it hit webs the current user did not have access to.
You will still get a credential prompt if you try to load the list collection for a web you have no rights to, but you will not get stuck in a “endless” loop of credential prompts.
New features:
In this version i have added the option to restrict edit access for a individual chart to a specific SharePoint user group. You find this setting in the Advanced option area in the “Edit Chart GUI”:
This is no “real” security setting as it only skips the rendering of the “edit chart button” and does not restrict the edit rights to the chart configuration list. If you want a true security setting you must change the permissions for each “chart” in the configuration list, or the permission for the configuration list itself.
Important!
v2.7 requires you to add one column of type “Single line of text” to the chart configuration list. The name of the field must be exactly “EditAccessGroupID” (without the quotes). Optionally you can delete the configuration list and have the script recreate it. The latter will result in you loosing all your existing chart configurations.
Please let me know if you find any bugs.
Alexander
Hello Alexander,
has loaded 2.7. Fist check: edit existing map. All misfunctions with selecting site has gone!
Great Work, now I must use it more to understand it better.
Kind Regards
Michael
FIRST check (pls, excuse the typo above)
Hi Alex,
This is a awesome stuff.
How do choose various chart types? Could you please help, I’m trying to fetch the 2axis graphs, Bar & Line chart in one etc.
Regards,
Ram
Hi,
This is not possible. Refer the documentation
Alexander
Wonderful stuff. I did this a while ago and it worked just fine, but my colleague (who is not an owner on the site) cannot see the graphs. He doesn’t see any error messages, just blank. Is there something I’m missing?
Hi,
I need to know which operating system and browser your college are using.
Alexander
We’re all using the say operating system and browser.
While I was troubleshooting I forgot that I used a 3rd party application called SharePoint list form extensions to play with the view permission, at the time I created the graphs, there was a rule I put in that allow owners only to view. I took out that rule and it’s still the same.
OK never mind. I had broken the inheritance of the document library that contained the .js files where only owners can see it. That’s why only owners were able to see the graphs. Stupid me :D
I’m glad you figured it out!
Alexander
Hi – I’m attempting to get this up and running on SP2003.
It seems that SP2003 doesn’t recognise _SPUserID. Is there an alternative way to grab this data in 2003?
btw If I hard code my own user ID in the code it works pretty well.
Hi,
Sorry, but i do not have access to a WSS 2.0 site to check it.
Alexander
Hi Alexander, great job!
I have a question: is it possibile to hanlde events on the graphs made from your configurator?
For example, when I click on a piece of my pie chart I want to redirect the user to the same URL with a custom querystring appendix, which depends on the selected item…
Thanks in advance,
Elena
Ok, I’ve found a solution checking Google API docs and your js file: I put in the js source file after the line 966 “chart.draw(data,options);” a listener for the event.
If someone has my same need, this is the code I put after the 966 line:
google.visualization.events.addListener(
chart,
’select’,
function() {
var selection = chart.getSelection()[0].row;
var message = ”;
alert(’You selected ‘ + data.getValue(selection, 0));
}
);
Thanks again,
Elena
Hi,
Glad you figured it out.
Alexander
Had a question about the pie chart. I’m guessing that you are using the corechart package to draw the pie charts due to the “Warning: You cannot load both piechart and corechart packages at the same time on the same page.” Is that correct? The reason I ask is the legend does not show the totals when you are counting by a column. If I use the old school approach and draw using the piechart package I get the totals. Please let me know.
Forgot to mention… Thank you! This is a fantastic tool and I appreciate it greatly!!
Hi,
You are correct – it is the “corechart package”, and as far as i know, you only get the total when hovering a slice. Refer the documentation
Glad you like the tool!
Alexander
Hi,
This is working great for me. Just one thing.. I keep have multiple ‘Edit Chart’ arrows appearing, one underneath the other rather than just having one. They seem to add themselves if I edit the CEWP. This inturn pushes the charts further down the page each time a new arrow appears.
Do you know why this is happening? Im using SP 2010.
Also i see under the charts the number of items. They too seem to show multiple times one underneath the other.
Try not to put the code directly in the CEWP – place the CEWP code in a textfile alongside the “ChartUsingGoogleVisualizationAPI.js” and link it in using the “Content link” option.
SP2010 messes with the CEWP content if it is put directly in the HTML-editor.
Alexander
Thanks that worked for me!